Hypergeometric Calculator
Free Online Tool for Accurate Probability Calculations
The hypergeometric calculator simplifies complex probability calculations for scenarios involving finite populations without replacement. This tool delivers precise results, helping students, researchers, and professionals analyze real-world data efficiently.
What is Hypergeometric Distribution?
The hypergeometric distribution models the probability of observing a specific number of successes in a sample drawn from a finite population without replacement. Unlike distributions assuming infinite populations or replacement, it accounts for changing probabilities as items are drawn.
Key parameters define this distribution:
Total population size.
Number of successes in the population.
Sample size drawn.
Number of observed successes in the sample.
This setup applies to quality inspections or genetic studies where each draw impacts remaining items.
Hypergeometric Probability Formula
The probability mass function for exactly k successes is:
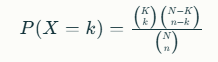
Here, (ba) represents the binomial coefficient, or “combinations,” calculated as b!(a−b)!a!. The numerator counts ways to choose k successes and n-k failures, while the denominator totals ways to choose any n items from N.
For cumulative probabilities, sum individual probabilities from 0 to k or k to maximum possible successes. Manual computation grows tedious with large numbers, making calculators essential.
Step-by-Step Guide to Using the Hypergeometric Calculator
Our free online hypergeometric calculator streamlines these computations. Follow these steps for instant, accurate results:
Enter Population Size (N)
Input total items, e.g., 100 units in a batch.
Specify Successes in Population (K)
Add defectives or targets, e.g., 10 defectives.
Input Sample Size (n)
Define draws, e.g., 20 inspected items.
Set Desired Successes (k)
Choose observed successes, e.g., exactly 2 defectives.
Calculate
Click to view individual probability, cumulative probability, mean, variance, and more.
The tool outputs results in decimal, fraction, and visual charts, with breakdowns showing intermediate combinations.
Real-World Applications of Hypergeometric Distribution
Professionals across fields rely on hypergeometric models for precise decision-making. In manufacturing, quality control teams sample batches without replacement to assess defect rates, ensuring product standards.
- Genetics and Biology: Analyze trait inheritance; calculate odds of specific gene counts in offspring from known parental pools.
- Survey Sampling: Determine representation of subgroups (e.g., demographics) in polls from finite voter lists.
- Card Games and Lotteries: Compute drawing specific cards from decks or winning numbers from pools.
- Inventory Management: Evaluate defective returns in shipments, like 6 faulty shoes from 10 sampled in a 200-pair consignment.
- Healthcare: Assess disease prevalence in tested patient groups from known infected populations.
These applications highlight why hypergeometric calculators prove invaluable in practical stats scenarios.
Statistical Properties: Mean, Variance, and More
The hypergeometric distribution offers clear metrics for analysis:
- Mean (Expected Value): μ=nNK. This matches binomial mean but adjusts for finite size.
- Variance: σ2=nNKNN−KN−1N−n. The finite correction N−1N−n reduces spread versus binomial.
- Skewness and Kurtosis: Vary with parameters; calculators compute these instantly.
For example, with N=50, K=10, n=5, mean is 1, variance ≈0.74—smaller than binomial’s 1 due to no replacement.
| Property | Formula | Example (N=100, K=20, n=10) |
|---|---|---|
| Mean | nNK | 2 |
| Variance | nNK(1−NK)N−1N−n | 1.65 |
| Standard Deviation | Variance | 1.28 |
Hypergeometric vs. Binomial Distribution
Hypergeometric suits without-replacement sampling; binomial assumes replacement or infinite populations. Binomial variance lacks the correction factor, overestimating spread in finite cases.
| Aspect | Hypergeometric | Binomial |
|---|---|---|
| Replacement | No | Yes |
| Population | Finite (N) | Infinite or large |
| Variance Factor | N−1N−n<1 | 1 (full p(1-p)) |
| Use Case | Batch sampling | Repeated trials |
Approximations hold when n << N, but exact hypergeometric prevents errors in small populations.
Advanced Topics in Hypergeometric Analysis
Multivariate extensions handle multiple success types, useful in multi-category quality checks. Fisher’s exact test employs hypergeometric for contingency tables in hypothesis testing, common in bioinformatics for gene enrichment.
Software like Python (scipy.stats.hypergeom) or Excel (HYPGEOM.DIST) implements this, but online calculators offer no-install access with visuals.
Frequently Asked Questions (FAQs)
What is a hypergeometric calculator used for?
A hypergeometric calculator computes probabilities for successes in non-replacement samples from finite populations, essential for quality control and research.
Can I use hypergeometric distribution for large populations?
Yes, but it approximates binomial when n/N < 0.05; use exact for precision in smaller sets.
How does sample size affect hypergeometric variance?
Larger n increases variance up to a point, but the finite correction shrinks it compared to binomial.
Is hypergeometric distribution symmetric?
Only when K = N/2; otherwise skewed toward population success proportion.
What’s the difference between hypergeometric PMF and CDF?
PMF gives exact k probability; CDF sums from 0 to k (lower) or k to max (upper).